Walking in the US: Technology on the Trail

A couple of weeks ago I was in Blacksburg, Virginia for a workshop called “Technology on the Trail“. CHCI, the Centre for Human Computer Interaction at Virginia Tech have an initiative of the same name and this workshop brought together academics and students at Virginia Tech. who have been working on the topic and four guest speakers from further afield including myself. Scott McCrickard was the organiser, but many others at VT led sessions, organised parts of the event or took part.

I was, of course, talking about the Wales walk, “Getting nowhere slowly: learning from a thousand miles at walking pace“, with a special slant on the tension between academic analysis of different themes and issues, and retaining a sense of the overall experience.

Amongst the other guests was Ellie Harmon. I was particularly excited to meet Ellie as she had been walking the Pacific Crest Trail at the same time as I was walking round Wales. Some years earlier she had also walked the Appalachian Trail. Her PCT walk was part of her PhD, which was an ethnographic study of the use of technology by long-distance walkers on the trail. I was particularly fascinated by the differences between the US long distance trails which are both substantially longer than the round Wales path (AT 2000 miles, PCT 2600 miles, compared to just over 1000 miles for Wales Coast Path + Offa’s Dyke), and also far wilder, with often several days between road crossings, and then some way down these to towns for resupply. However, they do seem far better way marked and constructed than large swathes of the WCP!

The third guest was Allison Druin, who I know from her work on co-design with children, but is currently part way through a two-year secondment to the US National Park Service as Special Advisor for National Digital Strategy. She has been applying similar co-design practices to the entire NPS! The NPS is not just responsible for the large ‘wild’ National Park’s themselves, but also swathes of land in cities, including the Lincoln Memorial. She described the way every national park has its own app, and her efforts to ensure that there are common platforms as well as more engaging experiences on them.

The final guest was Norman Su, who I’d not met before. He is at Indiana University, but is originally a city boy. His work from his PhD on has been on subcultures, so in Indiana he decided to look at hunters including learning to hunt himself, typically alongside children who were at a similar novice level. The hunters often feel quite culturally alienated by those from urban areas who find shooting game distasteful (albeit often happily digging into an intensively farmed steak).  However, there are multiple sub-cultures within hunting itself, often defined by the technology they use, from those who use the most advanced weapons available, to those who use simple bow and arrow, or muzzle loading rifles. A key feature that emerged from his analysis is the idea of rules of a ‘fair chase’: pitting the skill of the hunter not just the raw technology against the animal, and also ensuring that any kill is a clean kill: one bullet — one carcass.

As well as talks by the guests, we had a number of workshop activity sessions including a role play taking a walk to the university duck pond as if it were a hike, and various design/brainstorming sessions looking at the synergies and conflicts between different stakeholders and potential technologies for use on the trail.

My chosen technology would be a small device with physical buttons (not touch screen!) and GPS, possibly integrated into a voice recorder. The buttons could be colour coded and allow you to simply tag a spot from a small pre-determined set (bad path, view, etc.) and perhaps leave a voice note. Later one can go back and add details, but while walking I’d like to just say “this is an interesting spot”, and move on.

One evening there was a small reception where students showed some of the projects they had been doing around the theme. This included cultural probes, text analysis of tweets about various long distance trails in comparison with their mission statements and a touch screen system to explore Ellis and my blogs about our walks.

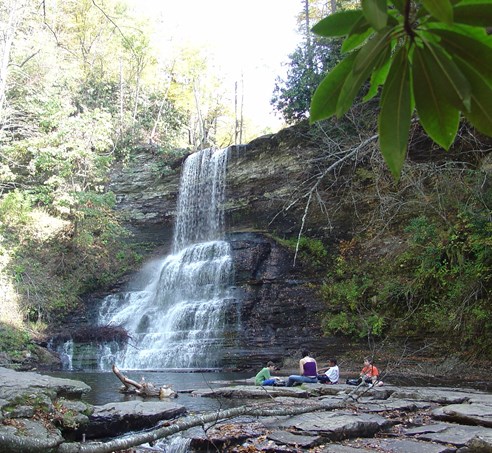
The workshop concluded with a short walk to he t66 foot Cascades waterfall, where the white foam of the falls was beautifully framed by white ice sheets across the rock face.  The photo below from virginia.org is clearly at a warmer time of year!

Reminders

There were so many conversations from things highly germane to the trail, to those more peripheral: Blacksburg’s single-screen, volunteer-run cinema’s Oscar nominee series, the nature of the Red Neck, the American Independence and Civil Wars (in the South, not utterly forgotten), and campaigning in the area at the last presidential election. Of course the latter things are not utterly independent of the workshop topic, as urban ideas of nature as object of preservation and leisure can often stand in conflict to more pragmatic rural connections to the land.

Aside from politics, there were two things I found myself mentioning repeatedly.

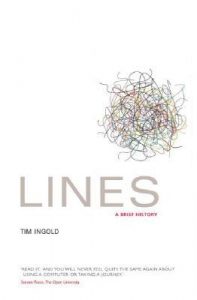
The first is Tim Ingold’s book Lines: A Brief History . Ingold’s thesis is that we have privileged the point or place in modern thought, seeing the connection as merely the means of getting from A to B. Ingold is an anthropologist and spent time studying reindeer herders. Their way of life is to follow the herds as they make seasonal migrations; for the tribes following the herds it is the way they follow, the path, the line, which is primary. Ingold has also edited a collection, Ways of Walking.

The other was MonmouthpediA.

Monmouth is a small county town on the border between Wales and England, but in 2012 it became “the world’s first Wikipedia town”. I am amazed at how few people in academia have heard of the project, indeed I probably would not have myself if it were not for the walk.

MonmouthpediA was a joint project between WikiMedia and various local councils and agencies, which included creating a special area on Wikipedia with entries for pretty much every building ad location in the town, free WiFi over parts of Monmouth, and, most significantly, small plaques with QR codes everywhere in the town linking to their MonmouthpediA pages.

With the benefit of hindsight I think it would have been better if they had used an intermediary URL, rather like tinyurl, this would have the made it easier to remap codes to content, including, for logged in users, contextually (e.g. children’s content, treasure hunts). However, for it’s time it is truly innovative and I’ve not heard of anything similar elsewhere since.

As far as I know there is not yet a world’s first Wikipedia trail!

Issues and Themes

Reflecting on the various presentations, group workshop discussions and informal talks during the visit, a number of themes emerged for me.

Marks

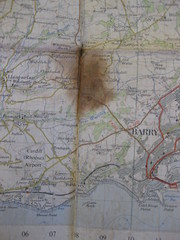
Part of the Wales Coast Path publicity was that it was “Way Marked”, hence as a rule (see also below) of my walking I followed these first and only consulted the route on a map (another marking) when I got lost from the markers.

Several more experienced walkers I met on the way had walked US trails, or Camino de Santiago in Spain remarked (sic) on the different quality of marking.

Things Ellie said and discussions during the Saturday Cascades walk, emphasised different natures of the laid out, or beaten path on the ground.

Marked and Unmarked Lines

(photo Wikipedia)

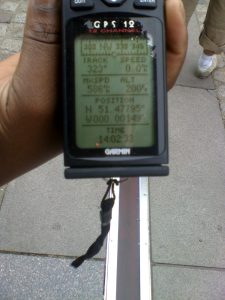
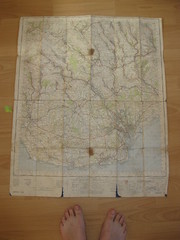
In the UK some long distance paths are waymarked, others deliberately not – you need to navigate to follow them … virtual paths. On Saturday Scott drove us “across the state line” (a phrase repeated so often in films) into West Virginia … a virtual line on the map, but also the road visible changed it’s character. We chatted on the walk about crossing the Equator and Arctic Circle – virtual lines, but ones with some physical identity, and the Greenwich Meridian, a purely arbitrary human line, but in Greenwich marked in the pavement.

The photo shows the Greenwich Meridian – marked on the ground and measured virtually with a GPS.   However, the two differ as UK longitude-latitude is slightly different from GPS long-lat indeed about 100 yards different at Greenwich … measuring where you are on a curvy earth is not straightforward.

Classes/kinds of marks

  • On the ground constructed – blaze, WCP roundels, direction signs, made paths
  • On the ground accidental – worn paths, signs of previous fires, litter, natural landmarks
  • On the map – lines or waypoints
  • Guide books, etc – often through geographic coordinates (remembering that even long/lat have multiple definitions differing by up to a hundred yards on the ground … that’s over a cliff!), but also place names, and landmarks

The latter connects to a chapter I’ve been recently writing about the ways physical and digital (or read more generally imaginary/virtual) worlds are connected (QR codes, etc.).

Absence of marks and knowing you have gone wrong

One thing I noted early while walking was the importance of cues to tell you when you are not on the path. This also has parallels in information systems design – error detection is as important as error recovery, indeed arguably more important as you cannot recover if you don’t know you have gone wrong … lots of links here to undo and things.

Ellie mentioned the frequent white blazes on the trees on the Appalachian Trail, and so, when she accidentally went off trail, she noticed quite quickly because there were no white blazes on the trees.

Note that this relied on the reliability of the waymarks, so that their absence was actually a sign in itself (rather like silence in speech). The lack of this reliability was, in contrast, a major problem on WCP, where they only seem to mark the ‘significant’ points (e.g. where the path exited a large open space), and, in some areas, even these erratically!

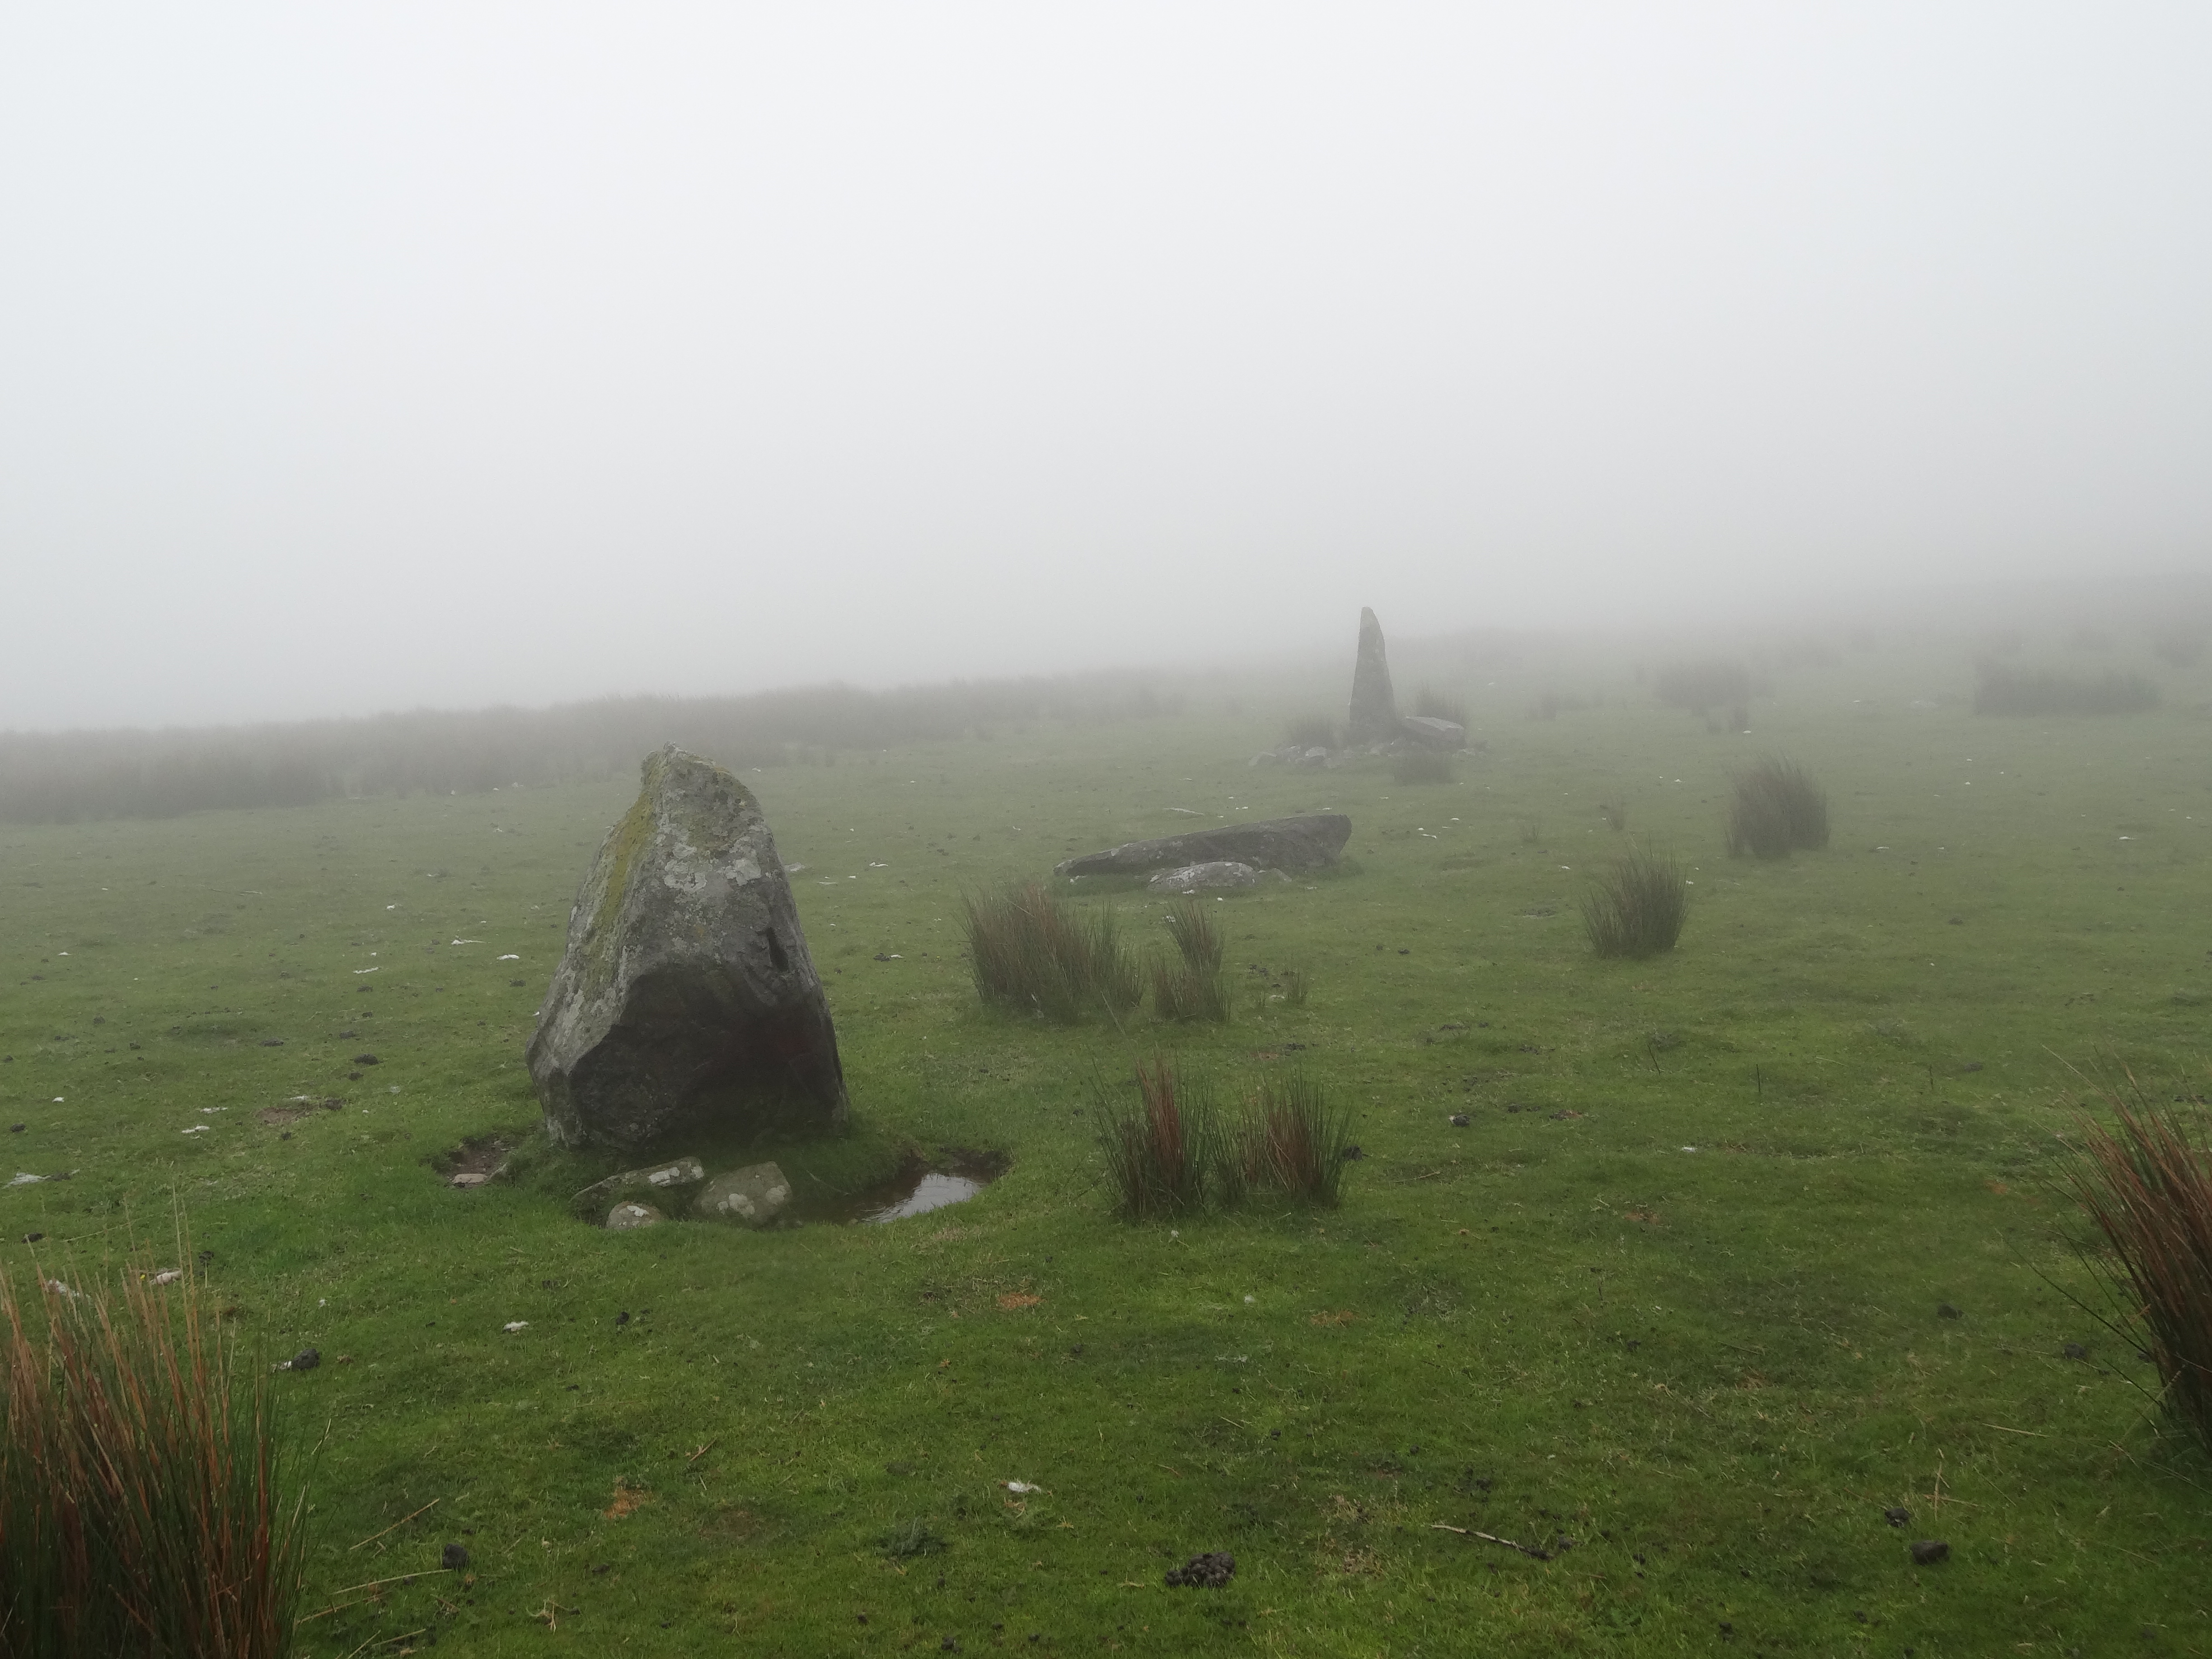
I recall one occasion (on the hillside about Fairbourne), where I was following a farm track and came to a gate. Straight onwards the path led beside a wall, but the farm track led through the gate. There was no WCP roundel on the gate, so I inferred that it was not the way to go … a big mistake that led to an hour or so wandering through thick mist on open moorland, criss-crossed with stone walls, that eventually led me round in an enormous circle! (N.B. climbing the walls would damage them, in most of the UK it is this kind of thing, not natural features, which limit navigation)

Hidden markers

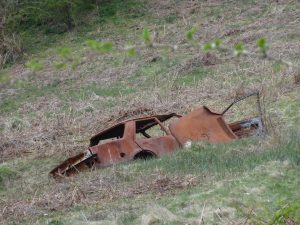
One reason the WCP markers were so small was, I think, so that they did not ‘mess up’ the countryside. Indeed, while I was walking, the Chair of the Long Distance Walkers Association, wrote a letter to members decrying the fact that on a couple of long distance paths, there had been incidents where someone had painted arrows on rocks to help guide walkers. As well as being criminal damage (remembering that there is little truly public land in the UK, only private land with rights of way), it also gave walkers a bad name. Although this was all perfectly correct, it was a point I pondered often as I struggled to find a 3 inch roundel across the far side of a field in the dusk or rain. The countryside is often far from ‘tidy’, full of fragments of baler plastic, discarded farm machinery, just about anything turned into feeders and water containers, and yet many in Britain have an image of the unspoilt rural idyll.

There are also good reasons for hiddenness. When the WCP crossed through built up areas roundels were attached to existing sign posts, but were rightly small as they are not relevant for the majority of people using the place (see meta-semiotics and Stanstead below). Indeed in some places, the normal 3 inch roundels, were reduced to small one inch ceramic disks and embedded into the pavement, very hard to spot even when you know they were there, but deliberately to be overlooked by those for whom they were not relevant … and also hard to vandalise.

I’m reminded too of Gypsy patrins (or patterans) and Hobo signs, which showed whether a house was a good one to beg at, or where other members of your group had gone, but were simple arrangements of stones or sticks that others would miss. The open WiFi chalk marks that sprung up in the late 1990s / early 2000s a similar example.

Rules

Norman’s hunters’ ideas of fair chase meant they created their own sets of rules about what was, or was not reasonable hunting practice. Ellie mentioned how some thru-hikers would not take a short cut when the path meandered up a mountain, or take alternative more scenic routes. I also had internal rules about conditions when I felt it OK to deviate from the set path: when I could get closer to the sea, or when I had got lost and it was ‘their’ fault (as in the WCP developers).

Information (in/about the land)

Rather like the marks for the path, information may be embedded in the land (e.g. the information board on the Saturday walk that told us about the old logging engine), or linked to it and presented elsewhere (guidebooks).

There are of course, digital versions of both these: public displays in location and smartphone apps, etc. linking from elsewhere.

I’ve a draft chapter about this for TouchIT (this chapter not yet online) about the different forms of linking (names, descriptions, QR codes, etc.)

Interestingly one of the distinctions for this is whether the points of linkage are physically inscribed in the land (e.g. QR codes for MonmouthpediA) or external to it (e.g. the PCT Halfmile waypoints).

In a project about ‘non-places’ (French philosopher Auge’s term), we had a meeting at Stanstead airport, and I became fascinated by the way signage sort of told you whether to there to read it or not, the meta-semiotics, of how to read a sign, who was intended to read it or not (see “not for itself: insider/outsider orientation of place and signage and systolic flows” ).

Names of places

This came up multiple times, not least whether a place having a name made it more significant.   … interesting connections to place/space

Flows

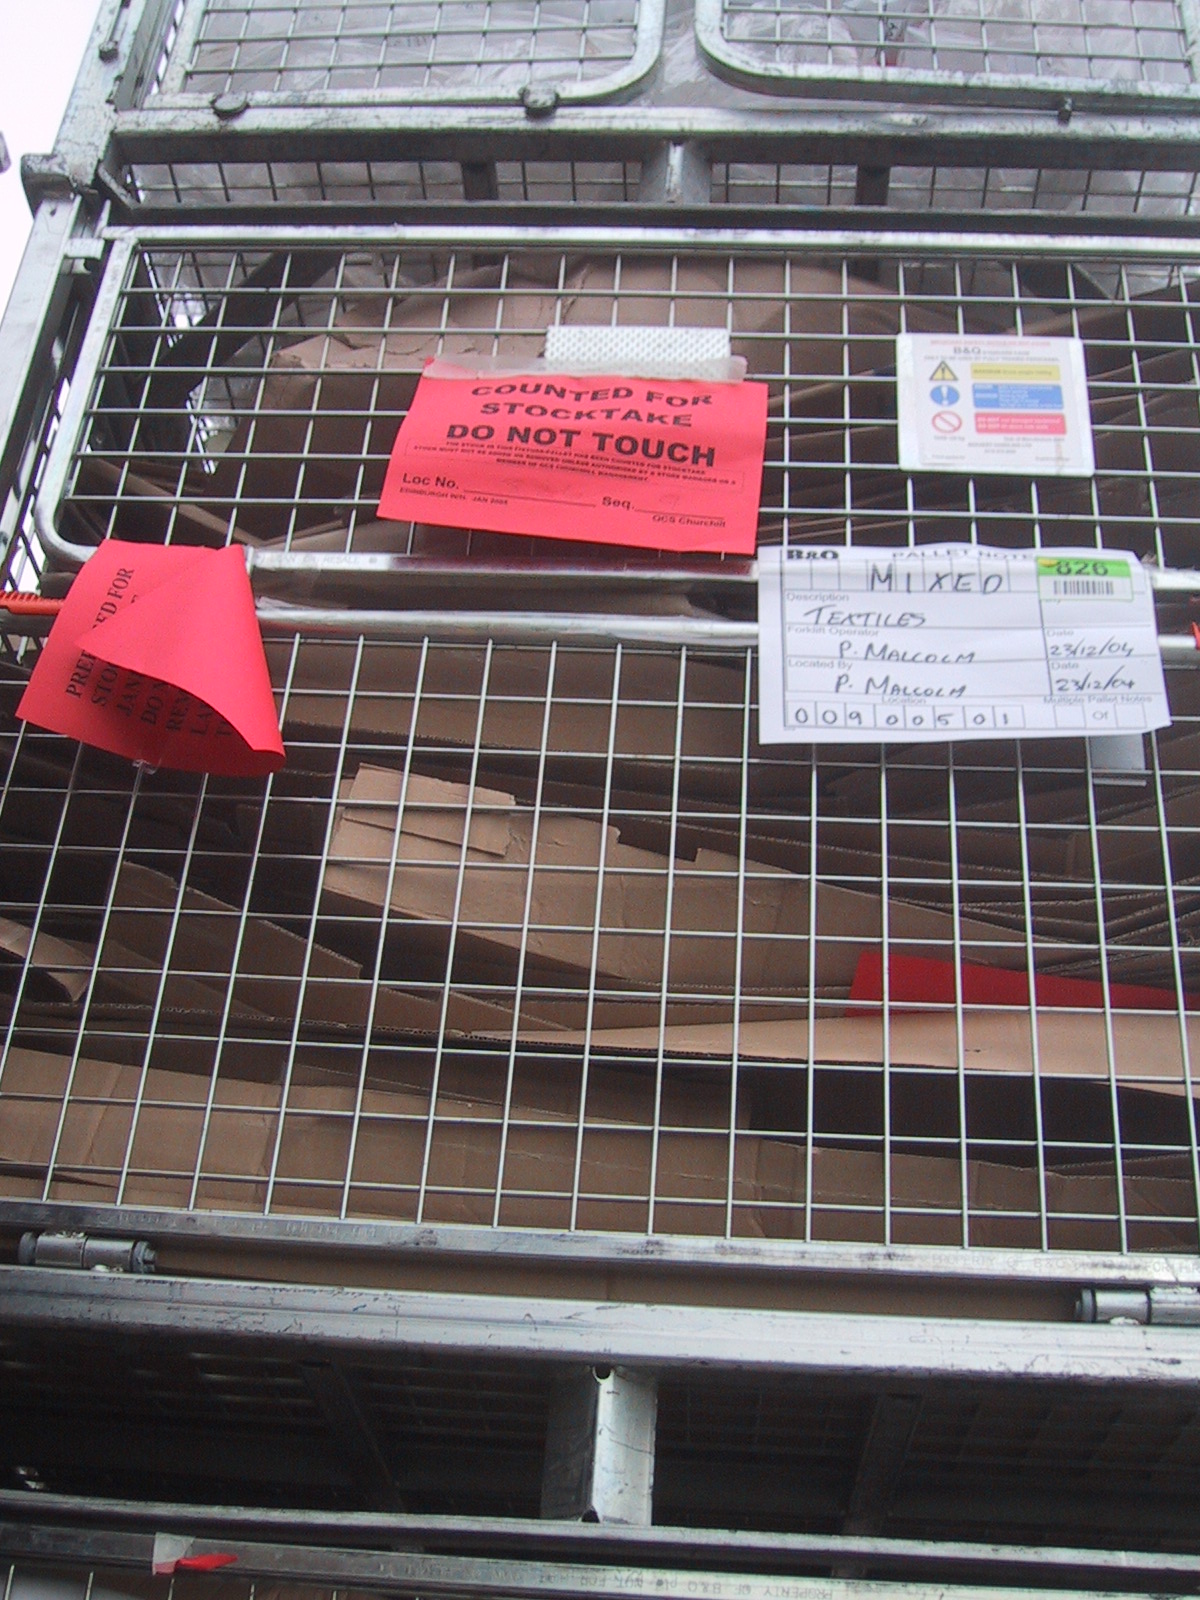
Another issue I first really became aware of in the non-places project, is about different flows human and material (I still have the photos of the back of a DIY store where we had another meeting).

As human flows are in space and time, for unconstrained 2D movements, you may never encounter those whose paths cross yours, but linear trails change this relationship. Passing people going the same way as you are, walking with them for a while, meeting people going the opposite direction, and those who live on the way (shop keepers, campsite owners, park rangers). There are also people who have walked the way before: flows along the same path, but at different times, leaving marks in the wear of feet, log books, guides, and even major motion pictures. This connects to another theme in my past work ‘absent presence’ the ways to be aware of others at the same place but different times.

People

One of the questions asked by a working group was “what are people”, and indeed we later had a workshop session focused laregely on identifying different stakeholder groups with interests about trails.

Here is one distinction (amongst others) that emerged from personal reflection prompted by Stavros Asimakopoulos’ grounded theory analysis of my blogs:

Egocentric/ people of life – These are the walker’s own individual community, linked to his personal existence. They are stable and long-standing, and largely geographically stationary but widely distributed.

Geocentric/ people of the land – These are the local community, people who live in the towns and places along the way. They are linked to a specific place. The relationships are typically fleeting, but the people themselves are largely geographically stationary and localized to the route of the path.

Tribocentric  / people of the way – The walking community, who are connected to the path, not any particular place along it. The meetings are fleeting and the people themselves geographically dynamic. (Note: this is from Greek ‘tribos‘ – a beaten track or path. )


I found a map

Sometime soon I need to check which maps I already have and fill in the gaps.  My OS maps are ordered on my shelves roughly by region, and the Welsh maps sit together in a few geographic groups.  Only then I spot, in the middle of a shelf, after the last of the Welsh maps give way to Stafford and the Peak District, just beyond the Isle of Man, an old, cloth map, stained by age, the cover long lost, and only a tattered bleached red remnant, suggests it is of the old one inch OS series.


Opening it up, I find it is of Cardiff and Glamorgan, the valleys black spider webs of railways before Beeching, a dark brown stain (water or campfire? odd that the two are indistinguishable with age) obliterates an area north of Barry Island.


My eye and finger trace old places walked, one day up beyond Caerphilly, rain-soaked amongst the coal tips; and places of childhood, Dynas Powis for the Whitsun sports, Ogmore for the dunes.  Some I’ll pass through again in a few months, others who knows?  But the map, a thing of magic, sometimes taking you away in your imaginations to places you have never seen, and sometimes back into your past.

award for art of cartography

The Ordnance Survey in collaboration with the British Cartography Society, have announced an award, the OS OpenData award, for work that spans art and cartography, using the hard data supplied in OS OpenData but combined with the flair of the creative individual.

The award celebrates the fact that “The creation of maps is a fusion of art, design, science and IT …”, reflecting some of the issues I’ve raised myself in recent posts such as “flowing cities – beauty in bits and buildings“, “maps in textiles“, and “Stilgoe on why precision is not always best” as well as general awareness of the importance of non-standard maps.

Stilgoe on why precision is not always best

Good article “You can have too much precision” on Guardian Geography blog by Jack Stilgoe picking up similar themes to my recent blogs on maps and mapping:

“The search for precision is a defining feature of scientific reductionism. But as our maps and models become more sophisticated, there is a danger that we lose track of why we have them.”

The text starts off looking at maps, including the Borges 1-1 map, but then applies this to climate science asking whether exactitude is more important than communication.

(cc) loronet@Flickr

Incidentally, if you don’t know the Borges story, it is repeated in the above post and basically is about the end of geography in mythical land due to the desire for ever and ever more exact maps, that are eventually the same size as the land being mapped.  The story ends:

In the deserts of the west, there are tattered ruins of that map, inhabited by animals and beggars

I have often thought that this would make a wonderful art project1, to literally make ragged fragments of 1-1 map and leave them in the locations they represent.  Anyone care to join me in this sometime (after the walk!), something you do in different places, sort of distributed-flashmob-like.

  1. Maybe my fascination with this is inspired in part by the 1966 television series “The Master“.  Two children are stranded at a secret base inside Rockall where an ancient scientist plans to take over the world. Deep in the heart of the base there is a chamber containg a huge map (not life sized, but BIG) where, at one stage, a minion is zapped to a charred patch by a giant laser.  The series was based on the novel “The Master: An adventure story” by T.H. White, but the episodes of the black-and-white TV series are now sadly lost.   [back]

flowing cities – beauty in bits and buildings

Flowing CityI have written quite a lot about the use of local maps that emphasise the identity of an individual or of a place.  However, there are also incredibly creative uses of maps that are more in the Cartesian tradition, combining geospatial data and digital mapping to creative visualisations that may be informative, subversive, beautiful and, at their best, all three at once.

As part of her master’s studies Margarida Fonseca has created Flowing City,  a stunning collection of visualisations of urban data1. From routes of Beijing cabbies, to galvanic skin response in Greenwich, and social network language in Milan, the examples Margarida has collected show the amazing ways different projects and individuals are remixing their own data, or publicly available data in order to make the often unseen patterns around us visible.

Urban computing with taxicabsGreenwich Emotion MapMaps of Babel

Many of the projects are by university research groups, but I’m also aware of many basic, but often transformative uses of data by simply mixing open data with Google maps or other similar technologies.  I’m wondering what it would be like if visualisations such as those found in Flowing City could be in the hands of every community group, urban or rural: campaigning for better transport, understanding education needs, preparing for floods.  But while pondering that I have downloaded a copy of Margarida’s thesis.

So, just browse the Flowing City site, compare with the Maps in Textiles I posted about a week ago: art and technology, the Cartesian and the idiosyncratic, may be not so far apart.

  1. Thanks @aquigley for sharing this link on Twitter. [back]

roots – how do we see ourselves spatially

I was looking through my blog and came upon the following post from 2011, which I’d forgotten about.  It seemed particularly relevant given my focus on both local maps and more personal maps such as Esther’s map in “maps of the imagination“. So I’ve reproduced it here.

Copy of “roots – how we see ourselves spatially” original post on my personal blog 2/11/2013

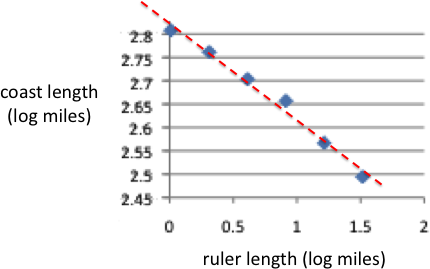
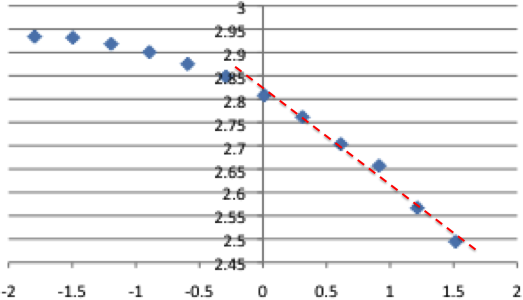
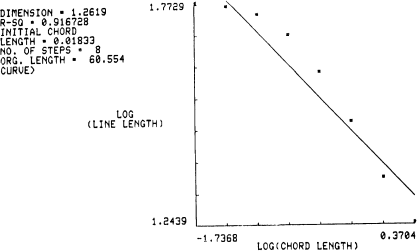
I was just reading the chapter on Benedict Anderson in “Key Thinkers on Space and Place1. Anderson forged the concept of a national imagination, the way nations are as much, or more, a construct of socio-cultural imaginings than physical topography or legal/political sovereignty.

However, this made me wonder whether this conception itself was very culturally specific, to what extent do people relate to nation as opposed to other areas.

I was reminded particularly of a conversation with, the much missed, Pierro Mussio. He explained to me the distinct nature of Italian cultural identity, which tends to focus on regional and local identity before national identity, partly because Italy itself is quite young as a nation state (a mere 150 years in a country which sees itself in terms of millennia). There is even a word “campanilismo”, which is literally relating to the “bell tower” (campanile) in a town, meaning one’s primary loyalties lie to that bell tower, that town, that community.

How do you see yourself? Are you British or Geordie, French or Parisian, American or New Yorker?

I know I see myself as ‘Welsh’. Wales is part of Britain, but my Britishness is secondary to Welshness. I was born and brought up in Bangor Street, Roath Park, Cardiff, but again while the street, area and city are foci of nostalgia, it is the Welshness which seems central. For Fiona she is Cumbrian (rather than Wetheral, English or British), Steve who is visiting is British, but says his brother would say Scottish, despite both having spent equal amounts of time in Scotland whilst growing up and since.

I asked people on Twitter and got a variety of answers2, most quite broad:

“I always think English rather than British but I don’t have a more specific area to identify with.”

“I think I primarily think of myself as both “Brit” & “northerner”. Lancastrian when differentiating myself from Yorkshire lot!”

“in decreasing granularity I’m a Devoner (south, of course!), west country-er, English, British, European, World-ean.”

Some less clear:

“I’m confused specially. I am Coloradan and American by birth, but feel more at home in England, and miss Scotland.”

“ooh, complicated. I’m British but not English. that’s as specific as I get.”

The last perhaps particularly interesting in its focus on what he is not!

Obviously the way we see ourselves varies.

The choice of a ‘level of granularity’ for location reminds me a little of the way in which we have some sort of typical level in a classification hierarchy (I think Lakoff writes about this); for example you can say “look at that bird”, but not “look at that mammal”, you have to say “look at that dog” or “look at that cat”. This also varies culturally including subcultures such as dog breeders – saying “look at that dog” in Crufts would hardy sound natural.

Some cities have specific words to refer to their natives: Glaswegian, Geordie, Londoner; others do not – I was brought up in Cardiff, but Cardiffian sounds odd. Does the presence of a word (Cumbrian, Welsh) make you more likely to see yourselves in those terms, or is it more that it is that, where cities have forged a strong sense of belonging, words naturally emerge … I sense a Sapir-Whorf moment!

Now-a-days this is even more contested as loyalties and identities can be part of networked communities that cut across national and topographical boundaries. In some way these new patterns of connection reinforce those focusing on human relations rather than physical space as defining countries and communities, but of course in far newer ways.

However, it also made me think of those parts of the world where there are large numbers of people with problematic statehood. There is how we see ourselves and how states see us. We tend to define democracy in terms of citizenship, and laud attempts, such as the Arab Spring, that give power to the people … but where ‘people’ means citizens. In Bahrain the Shite majority are citizens and therefore their views should be considered in terms of democracy, whereas the migrant workers in Libya fleeing the rebels in the early days of the recent Libyan war, or the Palestinians in Kuwait during the first Gulf War were not citizens and therefore marginalised.

Defining citizenship then becomes one of the most powerful methods of control. This has been used to powerful effect in Estonia leaving some who had lived the country for fifty years effectively stateless, and, while not leaving people stateless, in the UK new rules for electoral registration could leave up to 10 million, principally the young and the poor, voteless.

In the days of the nation state those with loyalties not tied to geography have always been problematic: Gypsies, Jews before the establishment of Israel, the various Saharan nomad trades. Many of these have been persecuted and continue to suffer across the world, and yet paradoxically in a networked world it seems possible that pan-national identity may one day become the norm.

  1. I’ve got 1st edition, but 2nd edition recently come out.[back]
  2. Many thanks for those who Tweeted responses.[back]

Maps in Textiles

Fiona pointed me to the wonderful web site of Valerie S. Goodwin, who creates quilts based on maps of real places and cartographic themes – stunning.


She also has a page listing other map-inspired artists, I visited a few and they were a joy too.  It is interesting that just as anodyne Google mapping is taking over the web, artists are reclaiming the medium and creating vibrant and individual images of real and imagined places.

British Library georeferencing old maps

The British Library are asking the public to geo-reference their collection of maps.  Just as I’ve described about local maps in maps of the imagination and in the maps section of this site, even maps designed to be ‘accurate’ in their time differ from modern mapping.  This project asks members of the public to geo-reference these maps aligning control points on the old map with points in Google Earth.

Henry Graber of The Atlantic had a go, and describes the experience, and more about the project in his piece “Good Deed of the Day: Help Geo-Reference the British Library’s Map Collection“.  This is his alignment of an 1857 map of Alexandria:

Alexandria – old map from British Library collection superimposed on Google map

Even if you don’t do any geo-referencing of your own, while you are at the British Library site, take a peek at their Magnificent Maps exhibition, which most definitely lives up to its name.  It includes the Fra Mauro mappa mundii that is described in James Cowan’s “A Mapmaker’s Dream“, which I have referred to so much over the years.

maps of the imagination

One of the main headings for this site is ‘maps‘, as they are both core to any real walk and also things of such wonder in themselves.  Not unexpectedly a number of my Christmas presents have been related to the Wales walk, and I’ll blog about these later.  However, one of them is a map of Wales, hand-drawn by Esther.

Just as I talk about in the page about maps, this is not a ‘standard’ map, not an attempt at cartographic verisimilitude, but more an open story of places and incidents, rendered from memory.  Tenby is north of Aberaeron, and Liverpool (with Wirral elided), where Esther now lives, extends across the whole length of North Wales.

On the map mountains are dwarfed by Janet and Rachel’s dogs, and Cardiff is represented not by the Castle, the Millennium Stadium or the City Hall, but instead by Bangor St where I was born and brought up, Daviot St where my mum lived for after selling the house, and the hospital where we took Esther as a tiny child running a temperature of 103 degrees (Fahrenheit not Celsius!).  Stone throwing seems to be theme with both the stone I threw as a child that saw my sister rushed to hospital for stitches to her nose and also the stone I threw at the school wall, but missed and hit the window.  What I never told the teachers was that I’d seen something about erosion on television and thought repeated stone throwing would reduce the school to a beach allowing is to make sand castes all day – never think small.

Esther’s map reminds me of medieval maps, like this 13th Century map on the cover of the  Penguin translation of Gerald Of Wales “The Journey through Wales and The Description of Wales” (another Christmas present!).  On this map, Wales extends almost to the current Scottish border, with the whole of Cumbria and Lancashire reduced to a vestigial headland.

Maps are always interpretations, focusing on what is important to the cartographer and reader, whether roads and towns, or lighthouses and anchorage depths; memories of places once known and promise of visits to come.


is the Welsh coast fractal?

In my earlier post ‘measuring it out‘, I wondered how fractal the Welsh coast is.

Shortly after writing ‘measuring it out’, I found a GPX file for the Welsh Coastal path at the Long Distance Walkers Association (LDWA) site, and realised, as well as being useful for many purposes, it would enable me to precisely measure the fractal dimension of the Welsh coast (or at least the coast path).

Fractals are those shapes that are sort of similar however much you magnify them: the way individual branches or twigs, may look like a whole tree when set in a miniature landscape.

Mandelbrot’s original work on fractals1 was motivated by the question “How long is the coast of Britain”.  The problem, known as the “Coastal Paradox“, is that as you look at smaller and smaller scales, you see smaller and smaller features and hence get a larger value for the length.  He suggests, based on earlier data of the cartographer Richardson2, that coastlines are self-similar – each magnified part has similar properties to the whole.  In Mandelbrot’s own words:

“Geographical curves are so involved in their detail that their lengths are often infinite or more accurately, undefinable. However, many are statistically ‘‘self-similar,’’ meaning that each portion can be considered a reduced-scale image of the whole. In that case, the degree of complication can be described by a quantity D that has many properties of a ‘‘dimension,’’ though it is fractional. In particular, it exceeds the value unity associated with ordinary curves”

The characteristic feature of a true fractal is that the length measured increases inversely as a power of the length the ruler used to do the measuring.  A smaller ruler means a bigger length, but with the precise rule:

L = K x R1-D

Koch Snowflake
(first four iterations)

The constant D is called the fractal dimension of the curve.  In the case of a smooth line or curve it is precisely 1, in the case of a space filling curve such as the Hilbert curve it is 2 and for the Koch ‘snowflake’ it is approximately 1.2623. If you then plot fractal curve length vs. ruler length, you see a straight line with slope 1-D.  Mandelbot, using Richardson’s data, and others, have found that the fractal dimension of coastlines of countries vary between about 1 and 1.3, with the fractal dimension of the west coast of Britain (a quite intricate coast) is about 1.25.

The GPX file on the Long Distance Walkers Association (LDWA) site has 14500 points marked over its 870 mile length; that is, on average, a point approximately every 100 yards (or metres).  This is almost certainly at a finer scale than Richardson considered in his work, which according to Shelberg et al.4, used ruler lengths of between 10 km and 1000 km for measurements.  In 1961 Robertson had to set a dividers to a scaled length and then walk the length of detailed maps.  In 1982, Shelberg and colleagues had to hand-digitise coastlines and then analysed them using computers one million times slower than those today. Doing the same analysis now, the slowest thing is parsing the XML of the GPX file to get the long-lat coordinates of each point, it is easy to get rapid results at a far finer scale.

So, is the Welsh coast fractal, and if so what is its dimension?

The figure below shows a log-log plot of the measured length against the virtual ‘ruler’ length from 1 mile (log = 0) to 32 miles (log ~ 1.5).  The red line has a slope of -0.2 suggesting a fractal dimension of 1.2, a little smoother than the whole British west coast (which includes the incredibly intricate west coast of Scotland), but toward the upper range of typical coastline fractal dimensions.

So, looking at this, yes, the Welsh coast path is fractal with a dimension of 1.2 … except …

… the average distance between points in the GPX trail is about 100m, with the smallest features around 25m.  The graph above only shows the upper end of distances above 1 mile, if the fractal analysis is extended as fine as possible, the curve starts to look very different. Here is the full graph including the ‘ruler’ lengths below one mile.

This now looks very different, with the points curving down to the left (smaller rulers) well below the straight line fitted to the larger ruler distances.

Now the first point or two represent features below the average point distance on the digitised GPX trail.  These are probably places where the path is particularly curvy, so are probably reasonable to include.  However, to be on the safe side, ignore the first two or three points.  Still, the graph is far from a straight line; that is it appears not to be truly fractal at all, smoother at fine scales than a true fractal would be.

Given the iconic nature of coastlines in the early fractal literature, this seems a little surprising, and indeed one can start to think of reasons for this.  Paths by their nature probably smooth out features.  However, this is the coast path, and following it on the official maps, it clearly does hug the coast as closely as possible; smoothing may happen at distances of a hundred yards or so (the bottom two or three pints on the graph), but not at distances between a few hundred yards and a mile, which are already dipping well below the straight line. Of course, the GPX file may not be accurate and ‘smooths’ the data, however, the inaccuracies needed would be several hundred yards, a long way off the path for a walker.

With this discrepancy in mind I looked in more detail at the Shelberg (1982) paper.  While Mandlebot’s Science article simply quotes Richardson’s data, Shelberg’s shows graphs of their results using the example of Kodiak Island in Alaska (a particularly intricate coastline!) with a 1653 point digitisation.

Scatterplot for Kodiak Island (Figure 5 from Shelberg et al., 1982)

The actual points are (in Shelberg et al’s words) “rainbow” shaped, and do not perfectly fit the line.  Following a slightly handwaving argument, the authors decide to effectively ignore the smaller scale data points, leading to a reduced range (recomputed, but effectively the right-hand side of the above graph), which, like the Welsh coast data, looks closer to a straight line … but of course any smooth curve, if looked at closely enough, ends up nearly straight.

I did wonder whether perhaps this deviation of coastlines from ‘pure’ fractal is commonly accepted, but on the Wolfram page for Coastline Paradix, it still says:

“a coastline is an example of a fractal, and plotting the length of the ruler versus the measured length of the coastline on a log-log plot gives a straight line, the slope of which is the fractal dimension of the coastline”

It is clear that the early authors were not intending to ‘massage’ their data, just that they came with a preconceived notion that the coastline will be fractal and assume that deviations are in some way errors, deviations, or noise.  Having removed the problematic data, the assumption is ‘verified’ deepening the folklore of the discipline

Similar self-confirming academic folklore is common. Indeed the same kind of graph with a ‘fitted’ line is common throughout the web self-similarity literature and, in HCI, Fitts’ Law leads to very similar misconceptions.

As with all folklore, these academic myths are based on truth: in this case coasts do get more wiggly as one looks in more detail, fractals (or at least fractal-like) shapes do occur in nature, and power laws do arise in many circumstances – just not everywhere and not perfectly.

Power laws are a good meme, but the world does not always comply!

  1. B. B. Mandelbrot (1967). How long is the coast of Britain? Statistical self-similarity and fractional dimensionScience: 156:636-638.[back]
  2. Richardson, L. F. (1961), “The Problem of Contiquity,” General Systems Yearbook, Vol. 6, pp. 139-187.[back]
  3. The precise fractal dimension of the Koch Snowflake is  log 4 / log 3.  See the Wikipedia page for a derivation.[back]
  4. Mark C. Shelberg,Harold Moellering and Nina Lam (1982). Measuring the Fractal Dimensions of Empirical Cartographic Curves, Defense Mapping Agency Aerospace Center St Louis Afs Mo.[back]