
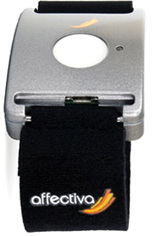
The sensor used for this was an Affectiva Q wrist-worn device developed originally by Picard’s Affective Computing group in MIT, then commercialised. Unfortunately it is now out of production, but the Q sensor resources page is still available explaining its operation. The device also measures skin temperature and has three-axis accelerometer.
The sensor is placed on the underside of the wrist, the opposite way round to a wrist watch, and the sensors face the skin. I always wore it on my left wrist.
on one occasion there are two files in one day where I accidentally knocked the device off and then had to start it again
fields:
name – file name
url – dropbox url
sampling_rate – always 8 = samples per second
timeset – ignore files where timeset = false, it means I did something wrong!
start_date – \ ___ date and time when recording starts
start_time – /
offset – always +1 I think this means BST rather than GMT
number_of_samples – number of data samples divide by 8 to get duration in seconds
identical data in JSON format
Each EDA file contains 8 lines of header information followed by data starting at line 9:
data columns:
Z-axis – \
Y-axis – > —- accelerometer data … in principle could get paces from this …
X-axis – /
Battery – battery level – ignore
ÔøΩCelsius – skin temperature in degrees
EDA(uS) – EDA in whatever they measure it in!! bigger means more emotion/stress/sweat
Note this is a CSV export from the raw EDA files produced by the Q sensor.
Extract of CSV meta file
name,url,sampling_rate,timeset,start_date,start_time,offset,number_of_samples 2013_04_18_timeUnset_b.csv,https://dl.dropboxusercontent.com/u/5863079/AlanWalksWales/AffectivQ-CSV/2013_04_18_timeUnset_b.csv,8,,000-00-00,00:00:00,+00,304282 2013_04_18_timeUnset.csv,https://dl.dropboxusercontent.com/u/5863079/AlanWalksWales/AffectivQ-CSV/2013_04_18_timeUnset.csv,8,,000-00-00,00:00:00,+00,405610 2013_04_19.csv,https://dl.dropboxusercontent.com/u/5863079/AlanWalksWales/AffectivQ-CSV/2013_04_19.csv,8,1,2013-04-19,10:03:24,+01,330670 2013_04_20.csv,https://dl.dropboxusercontent.com/u/5863079/AlanWalksWales/AffectivQ-CSV/2013_04_20.csv,8,1,2013-04-20,08:56:21,+01,365140 2013_04_21.csv,https://dl.dropboxusercontent.com/u/5863079/AlanWalksWales/AffectivQ-CSV/2013_04_21.csv,8,1,2013-04-21,10:04:17,+01,301553
Extract of EDA data file (CSV export)
Log File Created by Q Live - (c) 2012 Affectiva Inc. File Version: 1.01 Firmware Version: 1.71 UUID: AQL221200DG Sampling Rate: 8 Start Time: 2013-05-08 09:16:30 Offset:+01 Z-axis | Y-axis | X-axis | Battery | �Celsius | EDA(uS) --------------------------------------------------------- -0.220,0.370,-0.900,-1,22.000,0.032 -0.180,-0.060,-0.850,-1,22.000,0.020 -0.170,-0.040,-0.900,-1,22.000,0.020 -0.160,0.150,-1.340,-1,22.000,0.030 -0.360,0.000,-1.080,-1,22.200,0.034 -0.450,0.530,-0.980,-1,22.000,0.037 0.090,0.440,-0.800,-1,22.000,0.039 -0.320,0.500,-0.850,-1,22.200,0.041 -0.360,0.430,-0.860,-1,22.000,0.041 -0.350,0.640,-0.980,-1,22.200,0.036 -0.410,0.680,-0.730,-1,22.200,0.032 -0.400,0.500,-0.500,-1,22.000,0.032
we currently have data on the Q sensors and up until now we have been reviewing the graphs. Now we are ready to transfer the EDA files to CSV files but can have not been able to find how to do that. Can you give me the instructions for doing that
The utility you use to upload from the Affectiva Q device has an option to save as CSV.
EDA itself is proprietary format. It seems to have a plain text header, followed by binary data. The binary seems to be in 14 bit chunks (from the patterns it makes), so I am guessing this is 6 x 2 bytes for each channel (6 different values stored per line), plus something at line end.
… after a bit of time I’ve managed to 90% work out the data format.
looks like the top bit is the sign, the bottom 13 bits are the value itself .. and I have no idea whet the two bits in between do! There is a different scaling factor for the value in each column, divide by 100 for the first three accelerometer columns, 10 for temp column and 1000 for the EDA column.
I know this is an older post, but I wanted to thank you for making it; you helped a young programmer pull apart their first binary file, and really saved my bacon! Thank you!
The mystery bits are still a mystery, I’m afraid, but I did notice that they follow a pattern for every set of seven stored values: the first value (not sure what it measures…) always has 11, the XYZ orientation values have 01, and the battery, temp, and EDA have 10. Possibly markers for the type of data? Or configurations for it’s respective type of data?
The world may never know, but thank you again! If you ever find yourself in Boulder, Colorado, I owe you a beer! Walk on, good sir!
It seems http://www.qsensortech.com/resources/ don’t work , the group who manage Qsensor , have changing their objective , and work for face expression detection :
affectiva is now affdex .. :/
I was fortunate, they had already made the shift over a year ago when I downloaded the software, but were still keeping the support site live at that point. So I was able to get the software albeit only working with Windows 7!
hey
i just have a question about the csv file ( the last paragrah) where is writng the x-y-z axis and temp ….i want to know how can i analysis this file, i mean in each line i want to know what that mean, (to know what is the emotion of each line) if it is happy or sad or etc. so how can i analysis this file .tnx
regards
really sorry Mary, I missed your comment when you first posted it, so not sure of you will see this, or it be relevant so long after the event.
I have some data to upload to the site forma German student who performed a sentiment analysis on the blogs, but of course this is very low granularity compared to the EDA data.
In fact, I think, with a few exceptions, most of the EDA data should not be read as sentiment, but effort based. When ESA is used in lie detectors as an emotion measure the person is sat relaxed in a chair, with no exertion. Exertion effects seem to massively outweigh emotion. Cliff (prof at Bristol) some years ago had a front-facing camera wired to take photos when his heart rate peaked; he thought it would record the most stimulating orexc ting moments of the day. When he looked at the photo, they were always to the top of flight of stairs.
The exception to this is night-time reading when my body was at rest, but REM sleep is very obvious in the ECG data (not checked EDA) – pure thought could drive heart rate as high as the steepest gradient.
In principle as there is also GPX data and this can be correlated with on-the-ground gradients, it would be interesting to look for the exceptions – times when heart rate or EDA did not follow obvious points of exertion – these might then be point of emotion.
I’d be very happy to look at such points and try to remember of there were particular incidents that might have caused them. For example, the student who has created the sentiment data asked me about a particular morning when my heart rate shot to near 200 at 8am – I remembered that t was because I was due to meet someone and had been sitting reading so started packing in a hurry!
Dear Alan,
Is the EDA data still available? I couldn’t make the dropbox links work. This is a really interesting and inspirational project. Thanks for sharing your journey!
Sean
Thanks for reminding me, Dropbox changed the way they manage shared links, so I need to regenerate them … I think by hand for every link 🙁
This is the directory link for the CSV versions: https://www.dropbox.com/sh/4ug1pas1tkjqr9q/AACOBq-c5RzFg8C6_Q_dxPi4a?dl=0
and this is the EDA files: https://www.dropbox.com/sh/isznpvlj0wjf8iz/AACrlhs1xJCfV9q-GwyvBQn7a?dl=0
Hi Alan,
A couple questions:
1. Does timeUnset.csv simply mean that we do not have a start time to reference other than a rough idea that you started in the morning?
2. What are the gaps in the rows like in 2013_05_04_timeUnset.csv row 349792? Can I ignore that?
Best,
Sean
Got it. Thanks!