Although this is a WordPress blog, the bookshelf section I added last week is generated from a Workflowy list that Fiona created. Now Workflowy is a collaborative list-making web application, not a CMS or database, and yet effectively we are using it as exactly that.
While at first this seems odd, in fact it is:
- practically useful – we now have an automated workflow
- good from an interaction design perspective – Fiona is using an interface of her choice and with which she is familiar
- interesting academically – as an example of semi-structured data integration
With a gathering library of both existing books relevant to the walk and new presents at Christmas, I had been meaning for some time to share them on-line; not difficult, just needing time to collate details, scan covers, etc.. So, a few weeks ago I gathered together a pile of books, and then Fiona went through them scanning the covers and typing up details. We had been using Workflowy to share a to-do list for the walk as Fiona has become a great Workflowy fan1. It was quite natural therefore for Fiona to simply type the book details into the shared Workflowy list as sub-items under the ‘list’ task.
Having gathered these details, the next steps on the to do list were:
- design web page (together)
- populate web page (Fiona)
However, I realised that once the information had been copied into a web page if there were new books or edits, then either Fiona would have to do everything new straight into the web page, or try to keep her list and the web page in sync by hand. Perhaps we could use a more dedicated bibliographic tool such as Mendeley, Zotero or LibraryThing, but why use another interface when Fiona was already using one she was clearly comfortable with?
So, no new interface, no re-editing of data into a different system, no keeping web page and list views consistent by hand, instead the relevant portion of the Workflowy list is exported, copied into a Dropbox text file and then a web-based processor picks up the data from the Dropbox file and transforms it live into the bookshelf web page on this site. Fiona only ever edits the list and has to do the initial copying into the Dropbox file, and then everything else is automatic.
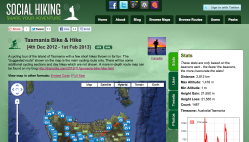
In fact one of the research agendas I have during the walk is data integration; trying wherever possible to link together existing data sources, or where I am creating new data or new applications, to make them linkable, reusable, etc. I have noted with interest existing applications that follow these principles, for example, Social Hiking for linking together social media as a record of expeditions, and PlaceBooks that allow the collection of different sources to make mini mobile guides to areas.

I am also interested in the use of semi-structured data, using data the ways people naturally enter it rather than force them to use some sort of standard format. For example, the HCI Book 3rd edition site is generated by using hidden web pages edited using Dreamweaver templates, but then stripping the data back out of those templates to be remixed in different ways on the site (e.g. showing exercises collected in a section of their own, but also under each chapter).
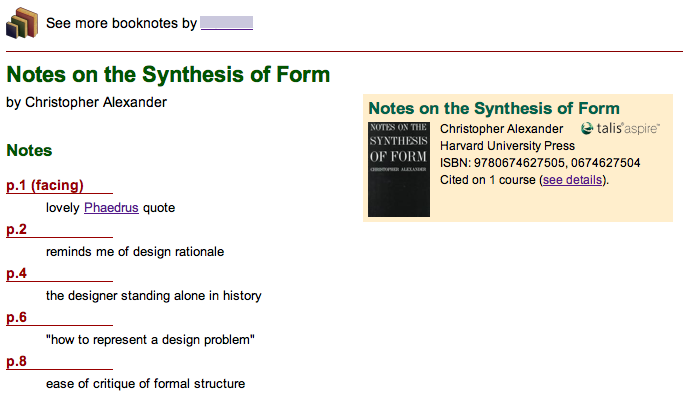
In the last few years I’ve also looked at extracting structured data from CSV and spreadsheet files and point and click ways to create semantic ‘screen scrapers’ for web pages. Indeed the BookNotes mini-app that I will be using to share book reviews and personal page-by-page notes is also based on lightly annotated plain text files placed in Dropbox2.
Traditionally computing has created interfaces and asked people to use them, effectively adapting themselves to the system. User-centred design tries to ensure that these interfaces are designed around the users’ understanding and often based on their existing work practices. Where there is semi-structured data already, we have the ultimate end-point of this, to simply use the existing formats that people have evolved for themselves and let the computer do the work to transform them into formats useful for automatic processing.
So, this was an opportunity to practice what I preach (!), if Fiona chose to put data into Workflowy, than that should be the ‘golden data’ and everything else flow from that.
So … a couple of hundred lines of code later, it works!
There was one small change to the raw data format to make it parsable: Fiona had used commas to separate title, author, publisher, etc., perfectly human readable, but some titles and publishers had commas in them, so this was changed to ‘;’. Also ‘blank’ fields were denoted by using ‘;;’ Otherwise everything was parsed exactly as Fiona had originally entered it, giving the page as it appears now. If more books are added, or edits made, all that is needed is to re-export the list to the Dropbox file and everything else is automatic.
Basically there are four stages:
stage 1 parse workflowy
Workflow allows lists to be exported either as formatted HTML or plain text. The plain text format was sufficient, and this is pasted into the shared Dropbox file.
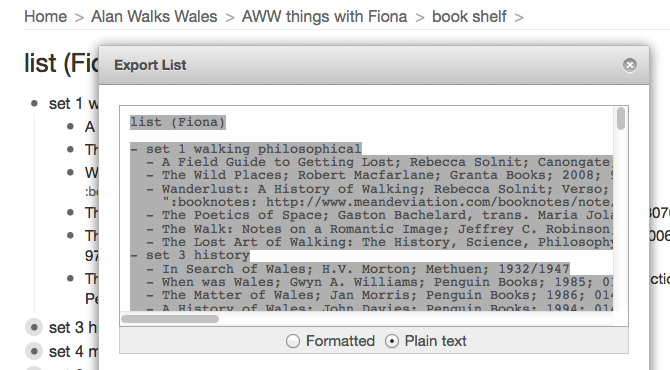
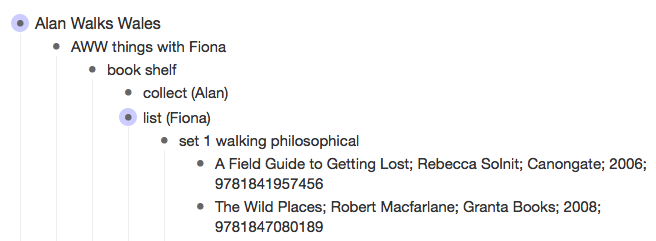
A share URL can be obtained for the file and this is used to configure the first stage. This is then parsed (approx 100 lines of code) to generate an internal data structure, shown below formatted as JSON.
[{
    "title": "list (Fiona)",
    "note": [],
    "children": [{
        "title": "set 1 walking philosophical",
        "note": [],
        "children": [{
            "title": "A Field Guide to Getting Lost; Rebecca Solnit;
Canongate; 2006; 9781841957456",
            "note": []
        }, {
            "title": "The Wild Places; Robert Macfarlane; Granta Books;
2008; 9781847080189",
        ...
stage 2 parse book list
Stage 1 is completely generic, books and sections are just items. The next stage further parses this to create lists of books. The presence of ‘children’ (sub-items) is used to decide the difference between a section and a book, and then the title line of each book entry is split on the semi-colons. There is a little tidying of the title for items with ‘(DVD)’ (i.e. media is not a book!) and to split the main title from subtitles (before and after the first ‘:’, ‘-‘ or ‘(‘), and a ‘slug’ is obtained from the main title to match with the image file names.
The code for this is approximately another 100 lines. The result of this phase is a book specific data structure:
{
"books": [],
"sections": [{
"title": "walking philosophical",
"note": [],
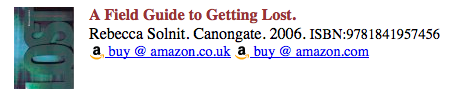
"books": [{
"title": "A Field Guide to Getting Lost",
"format": "book",
"author": "Rebecca Solnit",
"publisher": "Canongate",
"date": "2006",
"isbn": "9781841957456",
"slug": "afieldguidetogettinglost",
"slugpath": "set_1_walkingphilosophical\/afieldguidetogettinglost",
"isbn13": "9781841957456",
"isbn10": "1841957453",
"note": []
}, {
"title": "The Wild Places",
"format": "book",
"author": "Robert Macfarlane",
stage 3 format book list
It is then a simple matter to format the book data structure as HTML:
stage 4 embed book list
Finally the HTML is embedded into the WordPress post using a shortcode:
[embedurl url='https://alandix.com/exec/alanwalkswales/parse-workflowy.php?
url={dropbox url}&format=innerhtml' class='embedbooklist' /]
bells and whistles
There are a few extra elements. If a 13 digit ISBN is provided an equivalent 10 character form is created where it exists; this is in order to be able to generate Amazon links.
Also books can have notes added (see “She Won’t Get Far Her Bag’s Too Heavy” on the bookshelf) using Workflowy’s standard feature to add notes to any item. If any of the lines in the note have a special code (:tag:), then this is added to the fields in the book’s JSON data structure. This means that extra bits of structured data can be added as required (for example, if we wanted to point to an external cover image). In particular the Workflowy note for “She wont get far …” is as follows:
Wonderful romp of a book … although at 1 mile an hour in the early stages, not necessarily a physical romp! A plain speaking northern lass, sets out on the South West Path, never intending to travel the whole way round – makes me feel well planned.
:booknotes: http://www.meandeviation.com/booknotes/note/ewv5OlmRBfKgMjaLX7exsA
:isbn10: 1466219416
Note as well as the text of the note the extra tag with the url of my BookNotes for the book.
and now …
It probably didn’t take longer to code this up than it would have to copy the data into a web page and edit it, but even if it did take a little longer3, now I know that the book list data can be manipulated any way I like 🙂 In addition, the first stage will work if there are any other kinds of information that fits nicely into Workflowy’s hierarchical structure; I am sure we will reuse it. And the Workflowy folk say that an API will happen sometime, so maybe everything will be a list!
But of course I’m already looking at the stage 2 and 3 code and thinking, that is basically JSON transformation and formatting, surely that could be made more declarative and generic, maybe the whole pipeline could be made reusable as a tool.
Certainly I’ll make the stage 1 Workflowy to JSON part available if anyone else would like to use Workflowy as CMS … watch this space
- Workflowy is a ‘just’ an outliner / list editor, and yet does this simple job remarkably well. I wasn’t a PC user at the time, but I’m pretty sure one of the successful features of Norton Sidekick in the late 1980s was exactly a mini-outliner, but can’t find anything on the web about it — obviously too long ago![back]
- See “Designing APIs and Designing Value for an Education Graph” for more on the design of BookNotes[back]
- Yea, and I guess it probably it did, but that’s what geeks do![back]
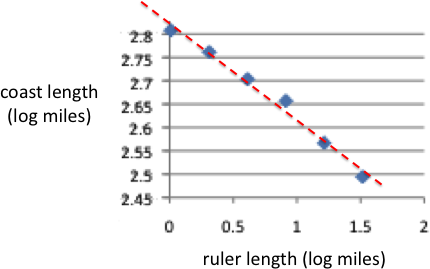
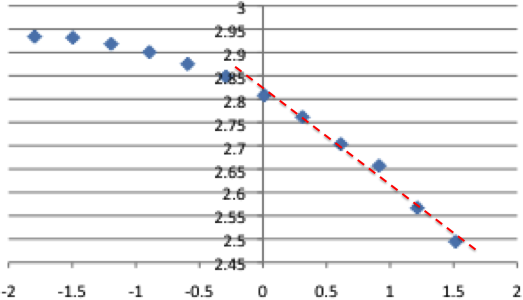
 Fractals are those shapes that are sort of similar however much you magnify them: the way individual branches or twigs, may look like a whole tree when set in a miniature landscape.
")