
Just read Ian Sommerville’s blog about his walking challenge next year. He is doing the TGO challenge, across Scotland in two weeks in May. While I’m sauntering round the coast of Anglesey, he will be cutting straight across the Scottish Highlands. Looking forward to hearing about his planning and progress.
Monthly Archives: November 2012
is the Welsh coast fractal?
In my earlier post ‘measuring it out‘, I wondered how fractal the Welsh coast is.
Shortly after writing ‘measuring it out’, I found a GPX file for the Welsh Coastal path at the Long Distance Walkers Association (LDWA) site, and realised, as well as being useful for many purposes, it would enable me to precisely measure the fractal dimension of the Welsh coast (or at least the coast path).
 Fractals are those shapes that are sort of similar however much you magnify them: the way individual branches or twigs, may look like a whole tree when set in a miniature landscape.
Mandelbrot’s original work on fractals1 was motivated by the question “How long is the coast of Britain”. The problem, known as the “Coastal Paradox“, is that as you look at smaller and smaller scales, you see smaller and smaller features and hence get a larger value for the length. He suggests, based on earlier data of the cartographer Richardson2, that coastlines are self-similar – each magnified part has similar properties to the whole. In Mandelbrot’s own words:
“Geographical curves are so involved in their detail that their lengths are often infinite or more accurately, undefinable. However, many are statistically ‘‘self-similar,’’ meaning that each portion can be considered a reduced-scale image of the whole. In that case, the degree of complication can be described by a quantity D that has many properties of a ‘‘dimension,’’ though it is fractional. In particular, it exceeds the value unity associated with ordinary curves”
The characteristic feature of a true fractal is that the length measured increases inversely as a power of the length the ruler used to do the measuring. A smaller ruler means a bigger length, but with the precise rule:
L = K x R1-D
")
Koch Snowflake
(first four iterations)
The constant D is called the fractal dimension of the curve. In the case of a smooth line or curve it is precisely 1, in the case of a space filling curve such as the Hilbert curve it is 2 and for the Koch ‘snowflake’ it is approximately 1.2623. If you then plot fractal curve length vs. ruler length, you see a straight line with slope 1-D. Mandelbot, using Richardson’s data, and others, have found that the fractal dimension of coastlines of countries vary between about 1 and 1.3, with the fractal dimension of the west coast of Britain (a quite intricate coast) is about 1.25.
The GPX file on the Long Distance Walkers Association (LDWA) site has 14500 points marked over its 870 mile length; that is, on average, a point approximately every 100 yards (or metres). This is almost certainly at a finer scale than Richardson considered in his work, which according to Shelberg et al.4, used ruler lengths of between 10 km and 1000 km for measurements. In 1961 Robertson had to set a dividers to a scaled length and then walk the length of detailed maps. In 1982, Shelberg and colleagues had to hand-digitise coastlines and then analysed them using computers one million times slower than those today. Doing the same analysis now, the slowest thing is parsing the XML of the GPX file to get the long-lat coordinates of each point, it is easy to get rapid results at a far finer scale.
So, is the Welsh coast fractal, and if so what is its dimension?
The figure below shows a log-log plot of the measured length against the virtual ‘ruler’ length from 1 mile (log = 0) to 32 miles (log ~ 1.5). The red line has a slope of -0.2 suggesting a fractal dimension of 1.2, a little smoother than the whole British west coast (which includes the incredibly intricate west coast of Scotland), but toward the upper range of typical coastline fractal dimensions.
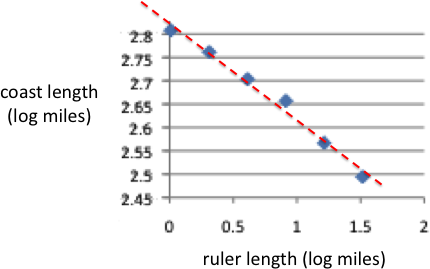
So, looking at this, yes, the Welsh coast path is fractal with a dimension of 1.2 … except …
… the average distance between points in the GPX trail is about 100m, with the smallest features around 25m. The graph above only shows the upper end of distances above 1 mile, if the fractal analysis is extended as fine as possible, the curve starts to look very different. Here is the full graph including the ‘ruler’ lengths below one mile.
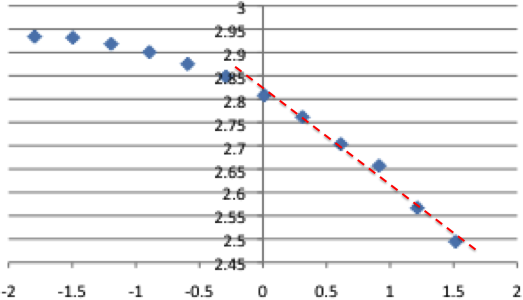
This now looks very different, with the points curving down to the left (smaller rulers) well below the straight line fitted to the larger ruler distances.
Now the first point or two represent features below the average point distance on the digitised GPX trail. These are probably places where the path is particularly curvy, so are probably reasonable to include. However, to be on the safe side, ignore the first two or three points. Still, the graph is far from a straight line; that is it appears not to be truly fractal at all, smoother at fine scales than a true fractal would be.
Given the iconic nature of coastlines in the early fractal literature, this seems a little surprising, and indeed one can start to think of reasons for this. Paths by their nature probably smooth out features. However, this is the coast path, and following it on the official maps, it clearly does hug the coast as closely as possible; smoothing may happen at distances of a hundred yards or so (the bottom two or three pints on the graph), but not at distances between a few hundred yards and a mile, which are already dipping well below the straight line. Of course, the GPX file may not be accurate and ‘smooths’ the data, however, the inaccuracies needed would be several hundred yards, a long way off the path for a walker.

With this discrepancy in mind I looked in more detail at the Shelberg (1982) paper. While Mandlebot’s Science article simply quotes Richardson’s data, Shelberg’s shows graphs of their results using the example of Kodiak Island in Alaska (a particularly intricate coastline!) with a 1653 point digitisation.
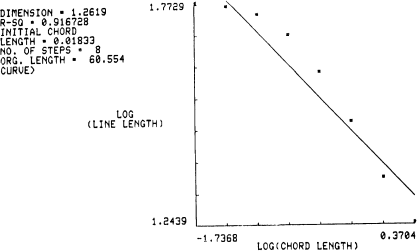
Scatterplot for Kodiak Island (Figure 5 from Shelberg et al., 1982)
The actual points are (in Shelberg et al’s words) “rainbow” shaped, and do not perfectly fit the line. Following a slightly handwaving argument, the authors decide to effectively ignore the smaller scale data points, leading to a reduced range (recomputed, but effectively the right-hand side of the above graph), which, like the Welsh coast data, looks closer to a straight line … but of course any smooth curve, if looked at closely enough, ends up nearly straight.
I did wonder whether perhaps this deviation of coastlines from ‘pure’ fractal is commonly accepted, but on the Wolfram page for Coastline Paradix, it still says:
“a coastline is an example of a fractal, and plotting the length of the ruler versus the measured length of the coastline on a log-log plot gives a straight line, the slope of which is the fractal dimension of the coastline”
It is clear that the early authors were not intending to ‘massage’ their data, just that they came with a preconceived notion that the coastline will be fractal and assume that deviations are in some way errors, deviations, or noise. Having removed the problematic data, the assumption is ‘verified’ deepening the folklore of the discipline
Similar self-confirming academic folklore is common. Indeed the same kind of graph with a ‘fitted’ line is common throughout the web self-similarity literature and, in HCI, Fitts’ Law leads to very similar misconceptions.
As with all folklore, these academic myths are based on truth: in this case coasts do get more wiggly as one looks in more detail, fractals (or at least fractal-like) shapes do occur in nature, and power laws do arise in many circumstances – just not everywhere and not perfectly.
Power laws are a good meme, but the world does not always comply!
- B. B. Mandelbrot (1967). How long is the coast of Britain? Statistical self-similarity and fractional dimension. Science: 156:636-638.[back]
- Richardson, L. F. (1961), “The Problem of Contiquity,” General Systems Yearbook, Vol. 6, pp. 139-187.[back]
- The precise fractal dimension of the Koch Snowflake is log 4 / log 3. See the Wikipedia page for a derivation.[back]
- Mark C. Shelberg,Harold Moellering and Nina Lam (1982). Measuring the Fractal Dimensions of Empirical Cartographic Curves, Defense Mapping Agency Aerospace Center St Louis Afs Mo.[back]